
Every MiFIR transaction reporting job in the P9 Portal now shows its full journey, from the file you sent to the feedback the ARM or NCA returned, on a single rail of seven dots.
Where did it stop?
A MiFIR transaction reporting job is not one event. It is a chain of them.
Files arrive. Onboarding data is loaded. Trades are parsed from the files. Point Nine runs its own validations. The trades that pass receive UTIs and are prepared as new or cancel messages. The submission goes to the ARM or NCA. Feedback comes back, record by record, as accepted, rejected, or still pending.
Each link in that chain can hold thousands of records, and each can fail for its own reasons: a missing instrument on one trade, an invalid personal identifier on another, a file that was received but never fully processed, or a submission uploaded without feedback yet returned.
Until now, establishing where a job stood meant one of two routes: asking us, or working through the notifications list to piece the sequence together. Both worked. Neither was quick, and neither gave a reporting manager a single glance to see which jobs are fine and which need a look.
The portal still gathers every detail from every stage, and all of it remains available. What you see first, however, is simplified: one row per job, and one rail of seven dots showing how far the job progressed and where, if anywhere, it stopped.
The Jobs View
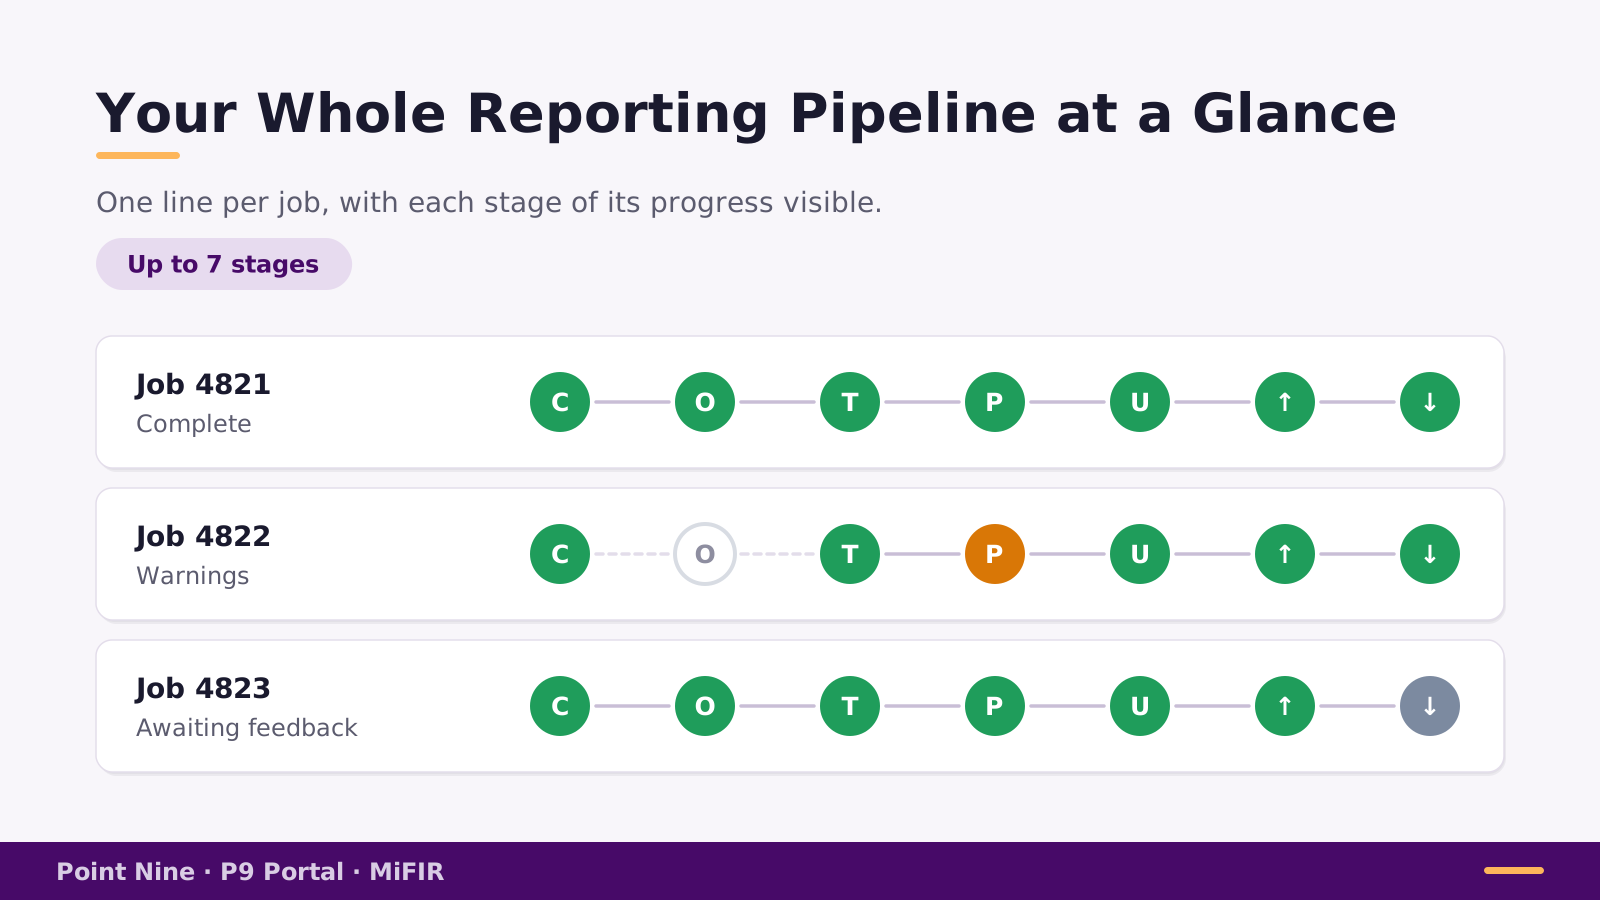
Figure 1. The MiFIR Jobs page, one row per job, with the five statistics columns, the coloured Status and the seven-dot Process rail
The Jobs page is the place to start. Each row represents one job and displays:
- Job ID
- Entity
- Input files
- Loaded records count
- Replayed chip (where earlier trades were reprocessed)
- Missing Data chip (where missing client details were reported)
- Last processed timestamp
Five statistics columns follow: Processing, P9 Validations, Valid Trades, Uploaded, and Feedback. Next is the Status column, which names the stage reached and colours it by severity. Finally, the Process rail displays dots C, T, P, U, an up arrow, and a down arrow, with an O inserted when an onboarding file was loaded as part of the job.
Every column includes an inline search box beneath its heading. Filtering the Status column by “error” or “feedback” narrows the list immediately. File names, replay source file names, and the literal phrase “Replay only” can also be searched directly to isolate replay runs.
A single click anywhere on the Process cell opens the job detail. The CSV export includes the replay columns so that the exported data matches what appears on screen.
The seven stages, explained

Figure 2. The stage legend, showing the seven stage markers and the five dot states
The rail reads from left to right in chronological order:
- C (Client File): The files received from you for this job.
- O (Onboarding File Loading): Displayed only when an onboarding file was loaded alongside the trades.
- T (Client Trades): The trades parsed from those files.
- P (P9 Validations): Internal checks run before anything is sent onward, summarised as E, W, and I counts for errors, warnings, and info.
- U (Valid Trades): Trades that passed validation, showing UTI counts and a split between NEWT and CANC messages.
- ↑ (ARM/NCA Upload): The submission sent to the ARM or National Competent Authority.
- ↓ (ARM/NCA Feedback): The response returned, split into A, R, and P counts for accepted, rejected, and pending.
Each dot displays one of five states:
- Solid green dot: Stage completed cleanly (OK).
- Amber diamond: Completed with warnings.
- Red cross: Error; needs attention.
- Hollow blue dot: Stage in progress or pending.
- Hollow grey dot: No data for this stage (empty).
A sequence reading green, green, amber, green, green, blue shows the full status without opening the job: the trades validated with warnings, were uploaded, and are awaiting regulator feedback.
The job timeline: click any step to see what happened
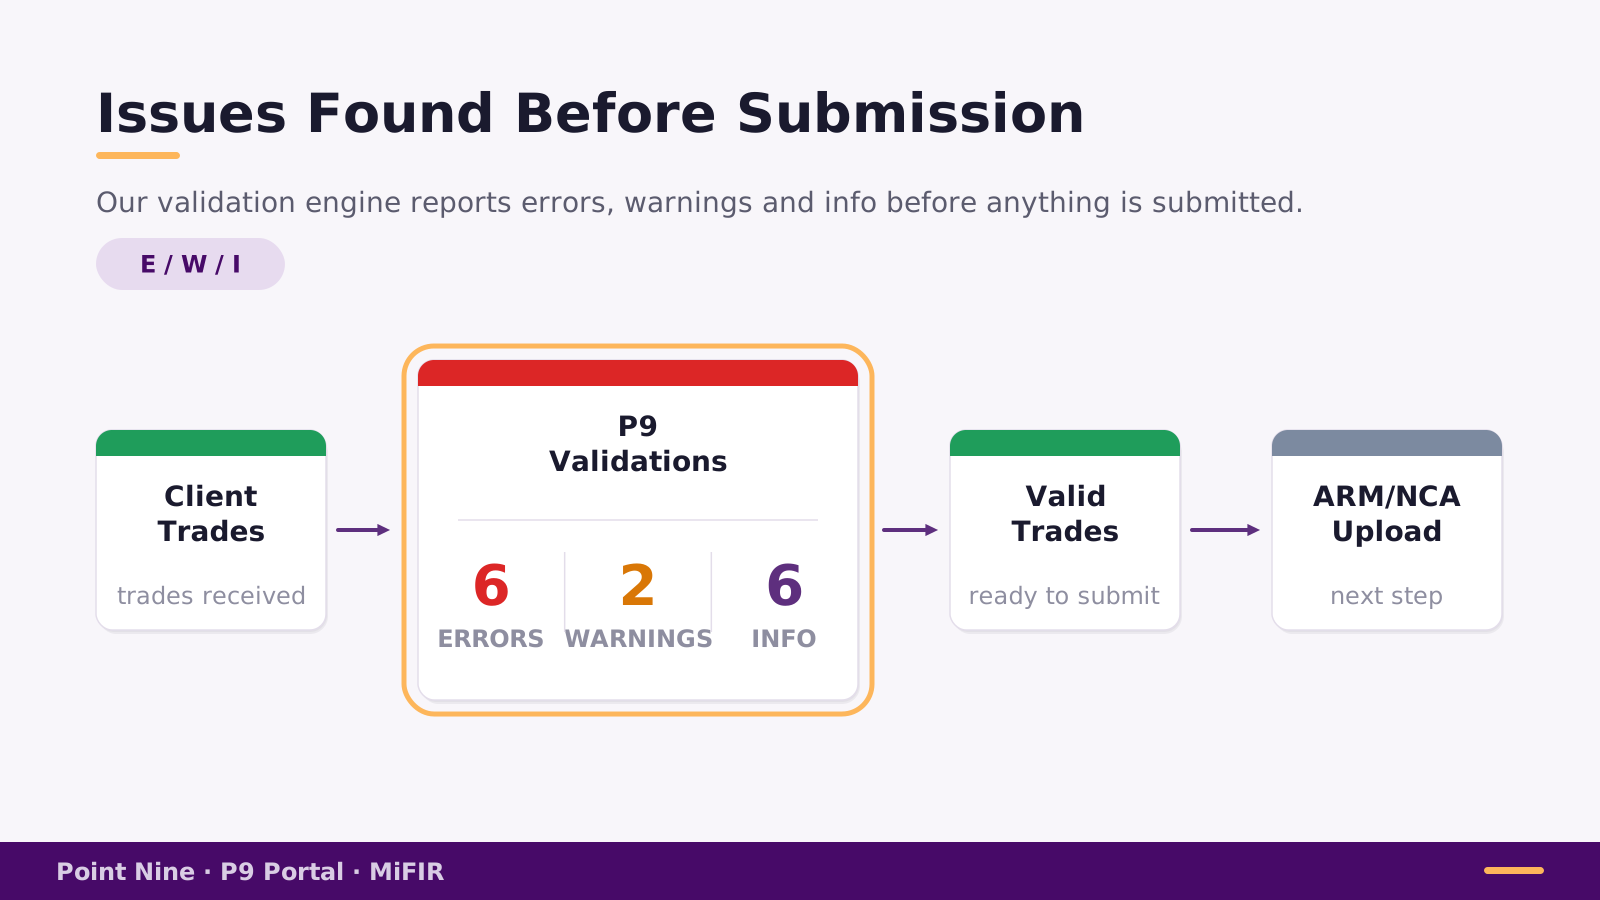
Figure 3. The job timeline dialog with the P9 Validations card expanded to show the individual notifications behind the counts
Clicking a job opens its timeline dialog, showing the seven stages as cards with status, timestamp, and a summary line (such as “2 files 236 records”, “E 14 · W 24 · I 9”, “29 UTIs · 29 NEWT / 0 CANC”, or “A 29 · R 0 · P 0”).
Expanding a card reveals the underlying records. For P9 Validations, this displays every notification raised with its level, code, text, client identifier type, identifier, and additional details. Notifications like “Missing instrument” or “personal identifier is invalid” map directly to the specific record responsible.
If a stage holds more rows than can be shown within the view cap, records are returned in priority order:
- For Client Trades, pending records appear first.
- For Valid Trades, errors appear first.
Replays, visible
Trades that cannot be reported on arrival due to missing or incomplete details are parked as incomplete or postponed. When the missing details are supplied, a replay run reprocesses them.
Replays have always happened; what has changed is that you can now see them.

Figure 4. The Replay sources popup, listing each source file, its originating job and the number of records replayed
- A replay job shows “Replay only” in the Files column because it has no new input file of its own.
- A “Replayed +N” chip opens the Replay sources popup, listing each source file, its originating job, and the replayed record count.
- Hovering over a source job provides a preview, and clicking opens it. The same Replay sources panel appears inside the replay job timeline.
- Searching a file name in the search box under the Replayed column isolates which job replayed it.
- The Files page includes the same replay linking, allowing traceability from both sides.
What is still waiting: the Pending Trades tile

Figure 7. The MiFIR Dashboard Trades Overview, with the Pending Trades tile stating its count, its breakdown and the replay run it is settled against
The Dashboard Trades Overview features a Pending Trades tile alongside Acceptance Quality to show outstanding items at a glance.
The primary figure shows trades held back for missing client details, split above into incomplete and postponed counts. An amber line counts records in submissions awaiting feedback from the ARM or NCA.
The tile indicates its data basis: either “as of replay Job N” with a timestamp (settled against the latest replay run), or marked as live while a replay is in progress. Colour changes by status: red while trades are pending, amber when only regulator feedback remains outstanding, and green when nothing is waiting.
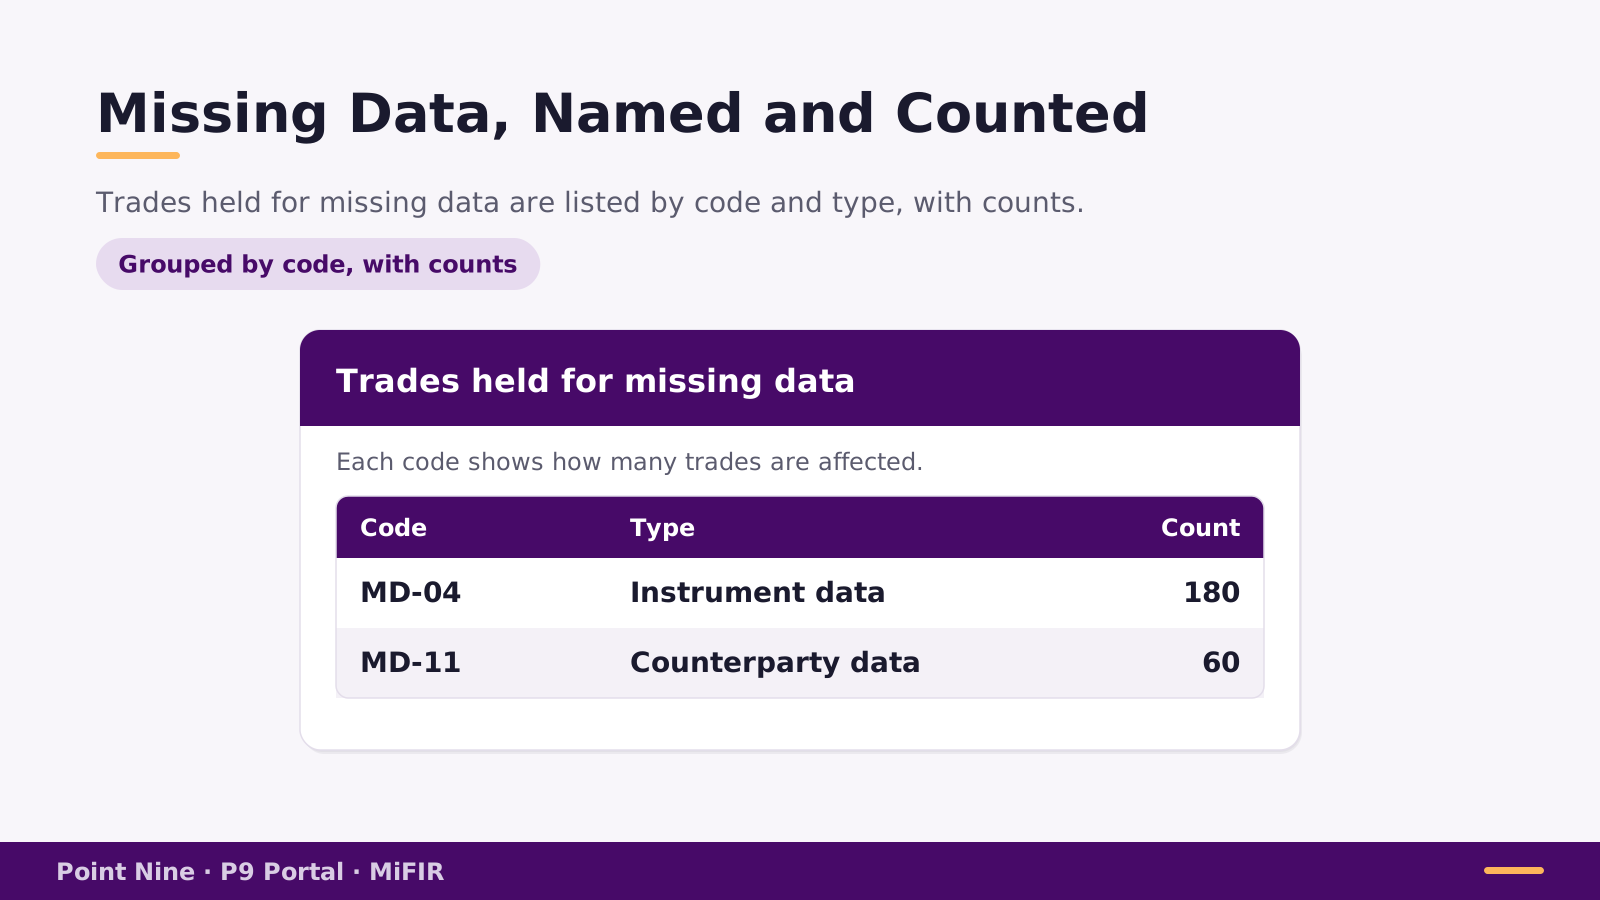
Figure 8. The Missing Data popup, grouping the notifications behind the pending count by code, client identifier type and client identifier
Clicking the chip on the tile opens the Missing Data popup, grouping notifications by Code, Client ID Type, and Client ID with group and total counts. When opened after a replay, it covers all files received since that run. Where postponed trades exist, the popup notes the archive policy (postponed trades archive after three months of missing data notifications).
The same Missing Data chip appears on each row of the Jobs page as a frozen record of what that specific run found missing.
Hover anywhere a Job ID appears
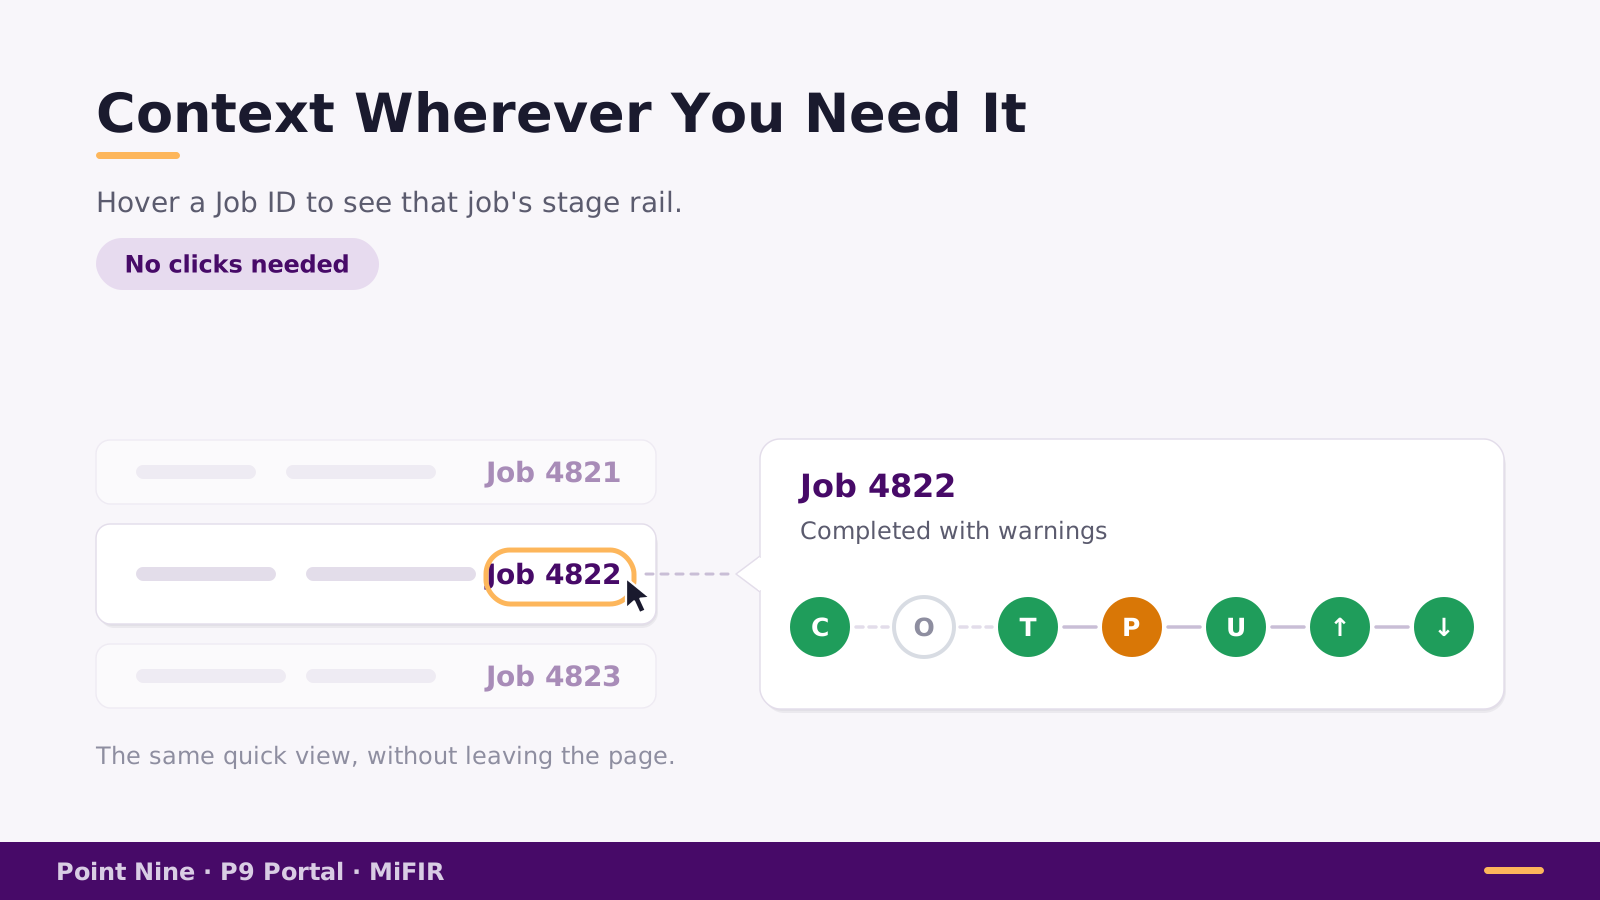
Figure 5. Hovering a Job ID on the Trades page shows the compact seven-dot quick view for that job
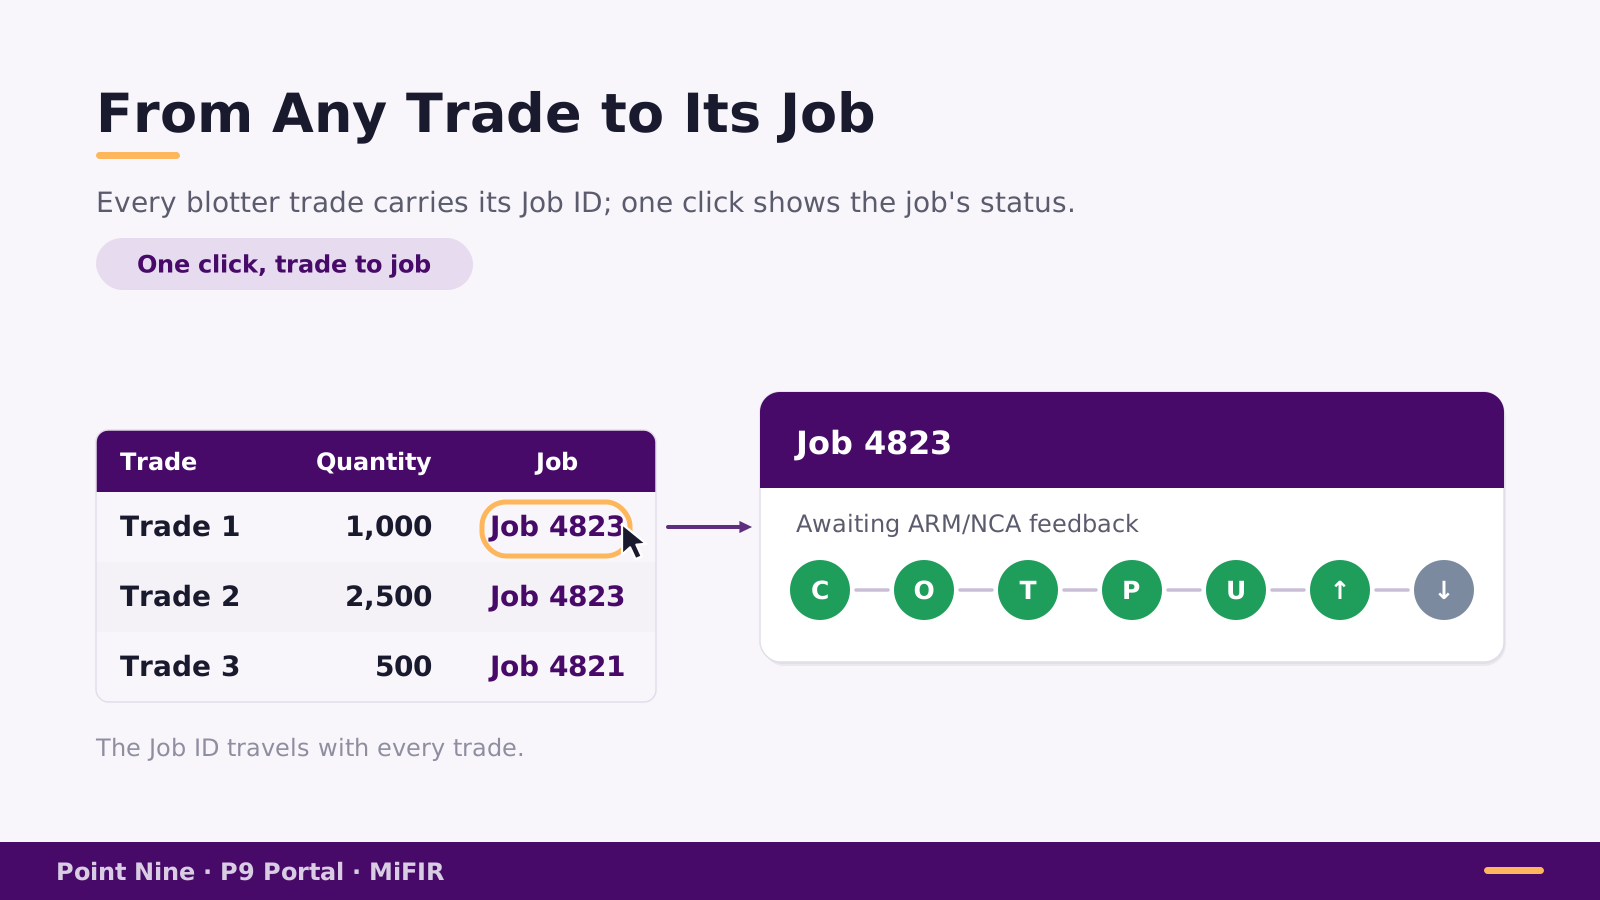
Figure 6. The same quick view opened from a single row in the Trade Blotter
Job IDs appear across the Trades, Files, and Notifications tables, as well as the Trade Blotter.
Hovering over a Job ID anywhere it appears opens the compact seven-dot quick view for that job. Clicking opens the full timeline dialog. This allows users to trace a trade directly from the blotter to its job and failure point without navigating away to the Jobs page.
How stage states are generated
Stage states are computed automatically from underlying records: files received, notifications generated during processing, submissions uploaded, and feedback files returned.
Replay detection operates from the notification stream, matching replayed records back to their initial file and originating job. High-volume counts are cached to prevent loading delays across large datasets.
This processing is presented through the seven-dot rail so that reporting managers can scan dozens of jobs quickly, verify completed runs, and open only those requiring attention. The full record details remain accessible one click below.
If you would like a walkthrough of these features against your own jobs, please reach out to the team at Point Nine.