In regulatory reporting, clarity is not a luxury simply a convenient feature; it is a core operational necessity. As reporting volumes grow and regulatory frameworks become more complex, organisations need immediate visibility through an advanced portal analytics dashboard to maintain compliance and reduce operational risk.
We are pleased to introduce the latest enhancement to our reporting environment: the completely redesigned, feature-rich portal analytics dashboard.
Designed for financial institutions, compliance officers, and operations teams, this update transforms complex raw reporting data into a clear, actionable narrative.
Key Features of the Portal Analytics Dashboard
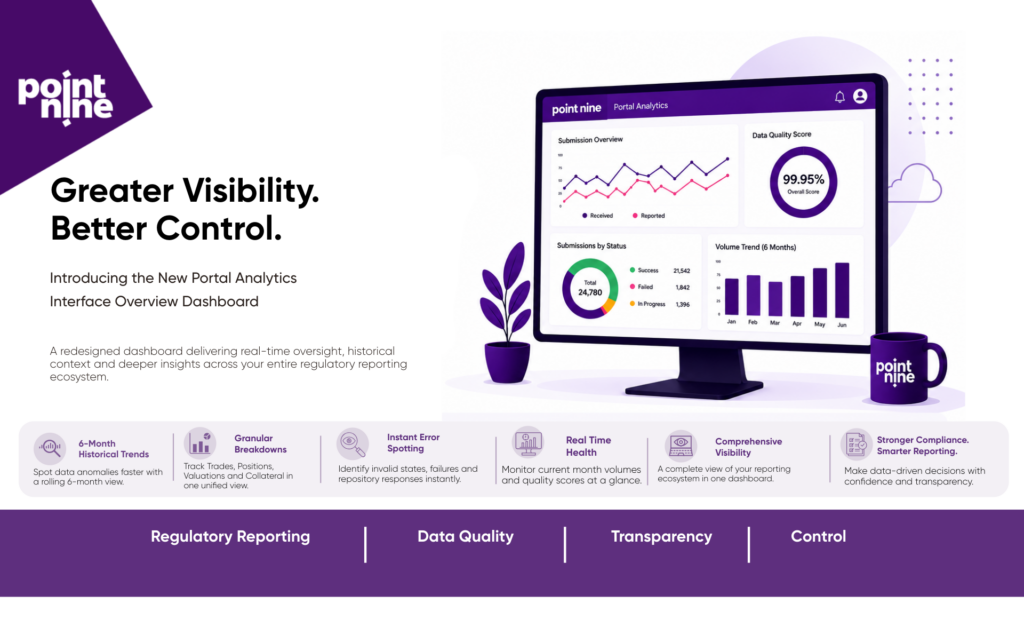
Our updated dashboard introduces a deeper layer of granularity and historical context, allowing you to monitor your entire reporting ecosystem at a glance.
- Macro-Level Performance Summaries: Users can track long-term milestones effortlessly, including cumulative figures for total transactions received, unique Unique Trade Identifiers reported, and overall processing quality percentages.
- Six-Month Historical Trend Tracking: There is no longer a need to navigate between multiple date menus to identify systemic changes. The portal now features a dynamic six-month retrospective view, breaking down data volumes received, successfully reported quantities, and monthly quality rates side by side.
- Comprehensive Record and File Segregation: The interface features detailed, tabular reporting that categorizes your data into specific instrument classifications, including Trades, Positions, Valuations, and Collateral. For every single asset category, users can trace the precise life cycle of their data, from received and processed states to invalid states, failures, and Trade Repository response statistics such as Acknowledgements and Negative Acknowledgements.
- Real-Time Month-to-Date Health Snapshots: A dedicated panel displays metrics for the current calendar month alongside overall quality scores, ensuring that you always know exactly where your month-to-date reporting stands.
Data is only as valuable as your ability to interpret it rapidly. By giving users immediate visual feedback on reporting quality trends over a half-year period, identifying underlying data lineage anomalies or systemic repository rejections becomes a matter of seconds. This update represents our ongoing commitment to making transaction reporting more transparent, efficient, and easier to manage for forward-thinking transaction reporting firms globally.
As global regulatory frameworks continue to evolve across jurisdictions, maintaining flawless data lineage is paramount for all reporting entities. Point Nine addresses these cross-border complexities head-on by delivering a future-proof architecture that effortlessly adapts to diverse, multi-regime reporting mandates, including the latest FCA regulatory updates and ESMA policy news across EMIR Refit, MiFIR, SFTR, ASIC, and MAS. By consolidating multi-asset transaction data into our unified portal analytics dashboard, we empower firms of all sectors to mitigate compliance risks, eliminate cross-jurisdictional reporting friction, and protect their operational bottom line.
Log into the Point Nine portal today to explore your updated metrics and experience the new interface firsthand.
Quick FAQ
- What is the Point Nine Portal Analytics Interface Overview Dashboard?
The Point Nine Portal Analytics Interface Overview Dashboard is an advanced data visualisation and monitoring console designed for transaction reporting institutions to track their regulatory transaction reporting health. It consolidates complex data streams into clean metrics, providing real-time oversight of submission status, quality scores, and historical data trends.
- How does Point Nine help firms improve their regulatory reporting quality?
Point Nine improves regulatory reporting quality by providing end-to-end data validation, automated error detection, and transparent life cycle tracking for all financial instruments. By highlighting invalid states and repository rejections in real time, firms can remediate data anomalies swiftly before they impact compliance standing. Contact us today to find out how we can streamline your multi-regime reporting workflow.
- Can I track specific regulatory metrics like Unique Trade Identifiers and Acknowledgements in the Point Nine portal?
Yes. The Point Nine portal tracks unique Unique Trade Identifiers from the moment of ingestion through to submission. It also provides explicit breakdowns of Trade Repository feedback, allowing users to audit successful Acknowledgements and isolate Negative Acknowledgements by specific asset classes such as trades, positions, valuations, or collateral.
- Why is a six-month historical trend view important for transaction reporting compliance?
A six-month historical trend view allows compliance teams to perform retrospective data analysis and identify systemic reporting patterns. Instead of viewing data in isolation, this feature helps Point Nine users identify seasonal volatility, persistent data lineage errors, or long-term fluctuations in reporting quality scores.